SaaS Talk™ with the Metrics Brothers – Details, episodes & analysis
Podcast details
Technical and general information from the podcast's RSS feed.
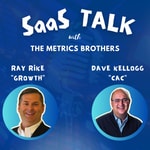
SaaS Talk™ with the Metrics Brothers
Ray Rike & Dave Kellogg
Frequency: 1 episode/10d. Total Eps: 85

SaaS Talk™ with the Metrics Brothers is hosted by Dave "CAC" Kellogg and Ray "Growth" Rike. SaaS Talk™ provides unique insights, strategies, tactics and the metrics to measure customer acquisition, customer retention and customer expansion success for B2B SaaS companies.
Each 20-minute episode will cover a topic critical to profitable revenue growth chalked full of practical advice that can be introduced and applied in most B2B SaaS companies.
Recent rankings
Latest chart positions across Apple Podcasts and Spotify rankings.
Apple Podcasts
🇺🇸 USA - management
29/07/2025#32🇺🇸 USA - management
28/07/2025#28🇺🇸 USA - management
27/07/2025#27🇺🇸 USA - management
26/07/2025#28🇺🇸 USA - management
25/07/2025#27🇺🇸 USA - management
24/07/2025#27🇺🇸 USA - management
23/07/2025#23🇬🇧 Great Britain - management
22/07/2025#71🇺🇸 USA - management
22/07/2025#20🇨🇦 Canada - management
21/07/2025#98
Spotify
No recent rankings available
Shared links between episodes and podcasts
Links found in episode descriptions and other podcasts that share them.
See allRSS feed quality and score
Technical evaluation of the podcast's RSS feed quality and structure.
See allScore global : 58%
Publication history
Monthly episode publishing history over the past years.
ICONIQ 2024 State of Go-to-Market Benchmark Report
Episode 53
mercredi 21 août 2024 • Duration 23:17
Go-to-Market continues to be a trending topic for the majority of B2B SaaS companies being challenged to optimize efficient revenue growth. ICONIQ recently published a report entitled "State of GTM Benchmarks" and Dave "CAC" Kellogg and Ray "Growth" Rike discuss the report's findings and what the benchmarks mean to both operators and investors.
Key GTM benchmarks covered during today's episode include:
- Growth Rate Trends ('24 vs '23)
- Customer Acquisition Logo Velocity
- Pipeline Coverage Ratio
- Pipeline Conversion Rates
- Partner Sourced Contributions
- Expansion ARR vs New Logo ARR
If you are a B2B SaaS CEO, CFO or GTM executive this episode is full of interesting insights based upon the most recent GTM benchmarks.
See Privacy Policy at https://art19.com/privacy and California Privacy Notice at https://art19.com/privacy#do-not-sell-my-info.
The New SaaS Mendoza Line - Growth Expectations for a SaaS IPO
Episode 52
mardi 13 août 2024 • Duration 22:51
The SaaS Mendoza line highlights the slope of the long term growth rate that investors expect and operators should target on a path to IPO. Dave "CAC" Kellogg and Ray "Growth" Rike break down the updated expectations.
Veteran software VC, Rory O’Driscoll of Scale Venture Partners proposed a theory to identify the growth rate below which a company may not be on the VC-to-IPO trajectory.
In 2018, Rory started with an analysis of SaaS companies at the time of IPO. In 2018, SaaS companies going public had a minimum run rate ARR of $100M and at least a 25% forward growth rate. He then examined growth rates over time and observed that the growth persistence - which represents the rate of growth decay year over year, that public SaaS companies grew at 80-85% of their previous year’s growth. This metric is commonly known as "Growth Endurance".
Dave and Ray discuss the new reality of the SaaS Mendoza line, with the most recent data in 2023-2024 suggesting that a SaaS company must have at least $400M - $500M" in revenue before they can IPO as evidenced by the recent Klaviyo, OneStream and Rubrik initial pubic offerings.
CAC and Growth highlight other common "growth expectation" models including the T2D3 (Triple, Triple, Double, Double Double) and 56789 models.
If you are evaluating what it takes for early stage company to attract new investors as your growth on a path to IPO - this conversation is full of great insights and perspective on investor expectations.
See Privacy Policy at https://art19.com/privacy and California Privacy Notice at https://art19.com/privacy#do-not-sell-my-info.
Is Pipeline Coverage Ratio simply the Inverse of Win Rate?
Episode 43
jeudi 6 juin 2024 • Duration 21:37
Is Pipeline Coverage Ratio simply the inverse of the win rate? Many people will translate a 20% win rate into the need for a 5:1 Pipeline Coverage Ratio - Dave "CAC" Kellogg and Ray "Growth" Rike dive into why that just isn't the case! There are multiple variables that need to be considered including:
- Win Rate versus Closed-Won Rate Conversion - there is a difference
- What happens to Pipeline Coverage Ratio when deals are pushed into or pushed out of the quarter
- How is Pipeline Coverage Ratio different in a 30 day sales cycle versus a 180 day sale cycle
- Bottom line - why Pipeline Coverage Ratio is NOT as simple as 1/Win Rate
See Privacy Policy at https://art19.com/privacy and California Privacy Notice at https://art19.com/privacy#do-not-sell-my-info.
2024 SaaS Account Executive Benchmarks - The Bridge Group Report
Episode 42
mercredi 22 mai 2024 • Duration 22:51
SaaS Account Executive Benchmarks including On-Target Earnings, Commission Rates, Quota, Quota Achievement, Renewal and Expansion Responsibilities are a few of the benchmarks that Dave "CAC" Kellogg and Ray "Growth" Rike discuss in this episode.
Account Executive Benchmarks discussion include:
- On-Target Earnings (2024 vs 2022)
- Base Salary and Variable Compensation Mix
- Commission Rates (2024 vs 2022)
- Quota Assignment by ACV
- Quota Achievement
- Renewal and Expansion Responsibilities
If you are leading a B2B SaaS sales team or have one in your company that directly impacts financial performance this is a must listen episode of SaaS Talk with the Metrics Brothers!
See Privacy Policy at https://art19.com/privacy and California Privacy Notice at https://art19.com/privacy#do-not-sell-my-info.
Redpoint Venture - State of the Market '24 Report Review
Episode 41
mardi 14 mai 2024 • Duration 21:59
Logan Bartlett, Managing Director at Redpoint Ventures recently shared the Market Overview Report they presented to their Limited Partners in March '24 at their AGM event at the Chase Center in San Francisco. Ray "Growth" Rike and Dave "CAC" Kellogg review the key insights during this episode.
Insights that Dave and Ray discussion include:
- Enterprise Valuations - a return to 2019
- Growth Rate trends - a return to a time long ago in a land far away
- The value of Growth vs Profitability - the trends and the facts
- Down Rounds, Shut Downs and No Rounds
Click here to get the report and to follow along Dave and Ray's conversation - as they sometimes go off the deep end!
See Privacy Policy at https://art19.com/privacy and California Privacy Notice at https://art19.com/privacy#do-not-sell-my-info.
Rubrik S-1 and IPO - A Growth and Profitability Metrics Review
Episode 40
mercredi 8 mai 2024 • Duration 23:53
Rubrik, a cloud industry cybersecurity company went public on April 25th - Dave "CAC" Kellogg and Ray "Growth" Rike break down the key metrics that Rubrik used as the foundation to their S-1 and Initial Public Offering. Those metrics include:
- Annual Recurring Revenue Growth
- Revenue (GAAP) Growth
- Net Revenue Retention
- Sales and Marketing Expenses as % of Revenue
- Free Cash Flow versus Net Income
The Metrics Brothers also discuss the Rubrik transition to a recurring revenue model and the two-tier stock structure used to ensure voting control remains with the founders and early investors.
See Privacy Policy at https://art19.com/privacy and California Privacy Notice at https://art19.com/privacy#do-not-sell-my-info.
Growth Endurance in SaaS - A New Normal?
Episode 39
mardi 30 avril 2024 • Duration 21:27
Dave "CAC" Kellogg and Ray "Growth" Rike discuss how a "growth rate" endures for a SaaS company trend over time!
Topics covered during the conversation include:
- T2D3 Growth Model and Mantra from 2015
- "56789" Growth Model from Metric Brother Dave "CAC" Kellogg
- The Impact of Growth Endurance decreasing to 65% in 2023 versus 80% in 2021
Growth Endurance is the measure of how a company's growth rate endures over time: GE = current year’s growth rate / last year’s growth rate.
At an 80% Growth Endurance (2021 value) says that a companies growth rate in the next year will be 80% of the current years growth
- example: 70% growth this year would predict 56% growth next year
Growth Endurance has decreased over the last two years and is NOW ~ 65% (2023)
- example: 70% growth this year would predict 45.5% growth next year
Growth Endurance decreasing from 80% to 65% may not sound that bad but let's look at the impact over 5 years at a $10M ARR company today but...
- 80% Growth Endurance = $189M ARR in Five Years (starting at $10M ARR)
- 65% Growth Endurance = $122M ARR in Five Years (starting at $10M ARR)
Using a 6.5x "Enterprise Value to Revenue" multiple that projects a material decrease in Enterprise Value 👇
- 80% Growth Endurance = $1.23B Enterprise Value in Five Years
- 65% Growth Endurance = $793M Enterprise Value in Five Years
The change in Growth Endurance translates into a $437M decrease in EV (at the same 6.5x multiple)
🤷♂️ If Growth Endurance has decreased by 15% over the past two years and Customer Acquisition Cost & Growth Efficiency have not improved materially over the past 7 quarters it might be time to change <insert ideas here>...
The "T2D3" Growth Model suggests the below ARR growth for a B2B SaaS company
- Get to $2M
- Next year: Triple to $6M
- Next year: Triple to $18M
- Next year: Double to $36MNext year: Double to $72M
- Next year: Double to $144M
The "56789" Growth Model suggests the below ARR growth for a B2B SaaS company
- Year 5: $10M
- Year 6:$20M
- Year 7: $50M
- Year 8: $75M
- Year 9:$100M
If you are a fan of B2B SaaS and have a desire or need to stay on top of the most recent trends this episode is a great listen!
See Privacy Policy at https://art19.com/privacy and California Privacy Notice at https://art19.com/privacy#do-not-sell-my-info.
SaaS Metrics Maturity Model - Part 2
Episode 38
jeudi 25 avril 2024 • Duration 24:23
Dave "CAC" Kellogg and Ray "Growth" Rike continue their discussion on the SaaS Metrics Maturity Model which includes the below five levels:
- Level 1: Foundation
- Level 2: Trust
- Level 3: Strategic Linkage
- Level 4: Metrics Culture
- Level 5: Trajectory
Level 1: Lay the foundation
- Definitions and calculations
- Pipeline stages, forecast categories, close dates, values, SaaS metrics
- Semantics - what do words like best case, forecast, commit and downside mean
- Instrument underlying systems (GL, CRM, Billing, HCM, etc)
- Consider Metrics Committee
Level 2: Build trust
- Templates, templates, templates
- Metrics selection & presentation
- History & context - always include footnotes on how metrics are calculated
- Regular Cadence: which templates used at which meetings?
- Continuous improvement - fix data at the source, improve templates
Level 3: Link Metrics to Business Strategy
- Identify your top challenges
- Define 4-6 strategic goals - align metrics to those goals
- Link department, team and individual objectives to the company metrics (OKRs)
Level 4: Build a metrics culture
- Demand numeracy
- Manage to the regular metrics publishing cadence
- Metrics conversations about the business impact NOT the metric calculation method
Level 5: Agree on strategic trajectory
- Long-range, driver-based models
- Timeframe: When are metrics goals targeted to be achieved, what are the milestones towards goal
- Sequencing: Not everything at once - what is the priority order and associated timeframe for each metric's goal
If you are a creator, user or participant in how your company uses metrics to measure performance, inform decision making and/or report performance to your boss, your board and your investors this conversation will be valuable!!!
See Privacy Policy at https://art19.com/privacy and California Privacy Notice at https://art19.com/privacy#do-not-sell-my-info.
SaaS Metrics Maturity Model - Part 1
Episode 37
mardi 16 avril 2024 • Duration 22:52
Dave "CAC" Kellogg and Ray "Growth" Rike discuss the 5 root causes that created the need to develop a SaaS Metrics Maturity Model for companies as they scale.
The top five root causes that lead to the 15 primary problems in how companies use metrics include:
- There’s no shared metrics foundation
- There’s no trust
- Metrics are not integral to strategy
- The culture is not metrics-driven
- Metrics are not being used define trajectory and long-term goals
This episode discusses the key challenges in using metrics and the approaches to address those challenges. This discussion builds up to the introduction of the Metrics Maturity Model and the 5 levels of maturity:
- Level 1: Foundation
- Level 2: Trust
- Level 3: Strategic Linkage
- Level 4: Metrics Culture
- Level 5: Trajectory
If you use, develop or just are a student of SaaS Metrics - this episode is full of insights and ideas on how to accelerate your company's metrics maturity model to level 5!!!
See Privacy Policy at https://art19.com/privacy and California Privacy Notice at https://art19.com/privacy#do-not-sell-my-info.
Customer Lifetime Value to CAC Ratio - The Ultimate Compound SaaS Metric
Episode 36
jeudi 11 avril 2024 • Duration 18:21
Dave "CAC" Kellogg and Ray "Growth" Rike discuss the Customer Lifetime Value to Customer Acquisition Cost (LTV:CAC) Ratio - a metric many consider the ultimate compound metric that investors love.
During this episode topics covered include:
- How to calculate Customer Lifetime Value
- How to calculate Customer Acquisition Cost
- Benchmarks for LTV:CAC Ratio and the translation to Rate of Return
- Primary input variables and predictive indicators to optimize LTV:CAC Ratio
If you have ever heard of the LTV:CAC Ratio or just are interested in some of the details and finer points from CAC and GROWTH - this is a entertaining and information episode!
See Privacy Policy at https://art19.com/privacy and California Privacy Notice at https://art19.com/privacy#do-not-sell-my-info.
